Pie Chart
Description
This example shows how to use the Microsoft Office Chart ActiveX Control.
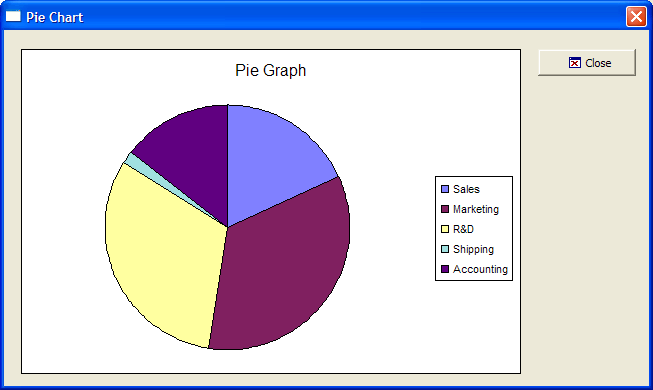
Example
To run this sample Xdialog script, you must have Microsoft Office installed on your machine.
Initialize the data series and labels.
dim data[5] as P
dim labels[5] as C
dim values[5] as N
dim vl as P
dim shared Chart as P
dim Graph as P
dim Graph.object as P
dim Graph.class as C
dept_value = <<%a%
Sales|123
Marketing|234
R&D|211
Shipping|12
Accounting|97
%a%
data.initialize_properties("Department|Value:N",dept_value)
for i = 1 to 5
    labels[i] = data[i].department
    values[i] = data[i].value
next i
vl = local_variables()
' The chart Graph
Graph.class="owc.chart"
dlg_title = "Pie Chart"
Display the dialog box, including the ActiveX control.
dlg_source = <<%dlg%
{can_exit=close}
{startup=init}
{lf};
{region001}
{stretch=height,width}
{sp}{activex=100,25Graph};
{stretch=}
{stickto=right,top}
{endregion001}
{region002}
{sp}<%i=$a5_window_close;O={J=C} {I=1} Close; %18,1.5&Close!close>{sp};
{endregion002}
%dlg%
Add code to handle button clicks and to create the chart object. SetData()is a chart method.
' Dialog Event Handlers
dlg_event = <<%code%
if (a_dlg_button = "close") .or. (a_dlg_button = "") then
    ui_modeless_dlg_close(dlg_title)
end if
if a_dlg_button = "init" then
a_dlg_button = ""
' Add a chart to the graph object
Chart = Graph.object.Charts.Add()
Chart.HasTitle = .t.
Chart.Title.Caption = "Pie Graph"
Chart.Type = 18
' See Complete List of Supported Chart Types for other types.
Chart.HasLegend = .t.
' Add the two series
dim series as P
Series = Chart.SeriesCollection.Add()
Series.Caption = "None"
Series.SetData(1, -1, Labels) ' Refer to XY Graph
Series.SetData(2, -1, Values)
Graph.object.Refresh()
end if
%code%
ui_modeless_dlg_box(dlg_title, dlg_source, dlg_event)
Limitations
Desktop applications only
See Also